SwarmMakie
SwarmMakie implements beeswarm or swarm plots in Makie. These are scatter plots which are categorical (or singular) in the x-axis, where the markers are nudged so that each marker is visible and avoids overlap.
The main entry point to the package is the beeswarm recipe, which takes the same arguments as Makie's scatter plots, and transforms them into a beautiful beeswarm plot!
Being a Makie recipe, you can also use this with AlgebraOfGraphics.
Quick start
Here's a quick example to get you started:
julia
using CairoMakie, SwarmMakie
xs = rand(1:3, 40)
ys = randn(40)
f, a, p = scatter(xs, ys; color = xs, axis = (; title = "Scatter plot"))
beeswarm(f[1, 2], xs, ys; color = xs, algorithm = SimpleBeeswarm(), axis = (; title = "Beeswarm plot"))
f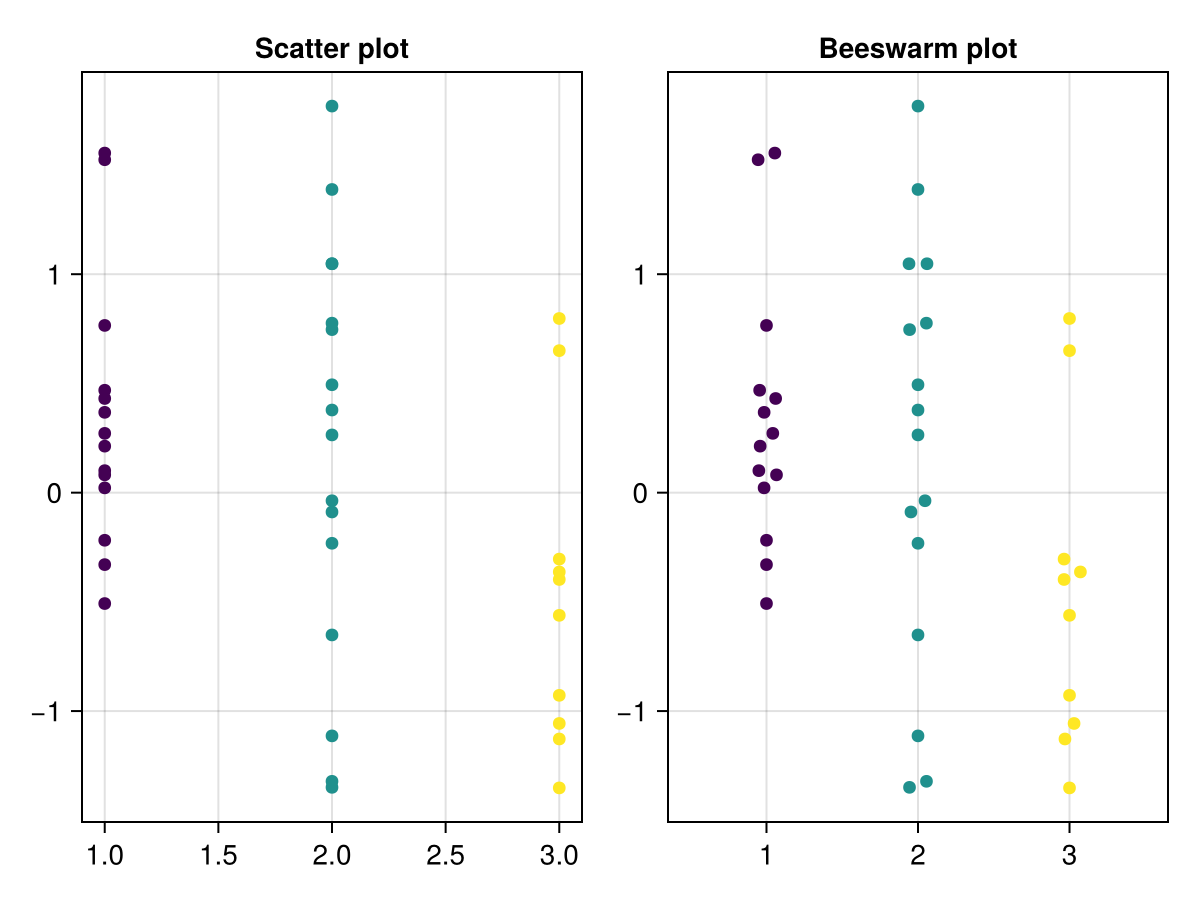
Use with AlgebraOfGraphics.jl
As a Makie recipe, beeswarm also composes with AlgebraOfGraphics!
julia
using AlgebraOfGraphics, CairoMakie, SwarmMakie
using RDatasets, DataFrames
iris = dataset("datasets", "iris")

f = data(iris) *
    mapping(:Species, :SepalLength; color = :Species) *
    visual(Beeswarm) |> draw
f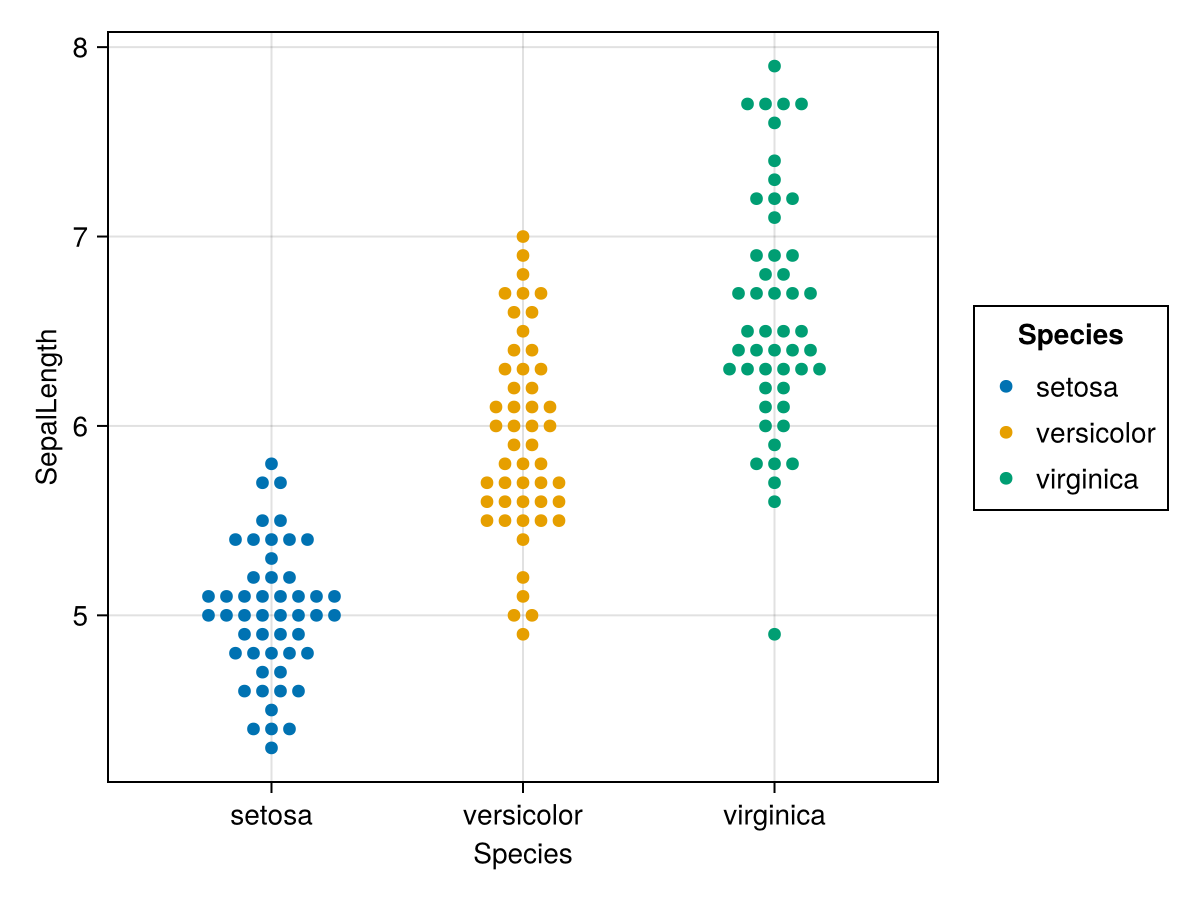
Tips and tricks
If your beeswarms are overlapping, or extending outside the axis area, try decreasing markersize. You can do this by setting plot.markersize = 6 for example, and then re-displaying the figure.