Nonlinear beeswarm plots
Beeswarm plots can be plotted in any combination of xscale and yscale.
Specifically, beeswarm plots are correct in any separable transform - basically, any transform in which the x and y coordinates are independent of each other. This excludes most geographic transformations, but includes any transformation you can make using xscale and yscale in a Makie Axis.
julia
using SwarmMakie, CairoMakie
data = randn(75) .+ 3
fig = Figure()
ax1 = Axis(fig[1, 1]; title = "No transform")
beeswarm!(ax1, ones(75), data)
ax2 = Axis(fig[1, 2]; title = "Log y axis", yscale = log10)
beeswarm!(ax2, ones(75), data)
fig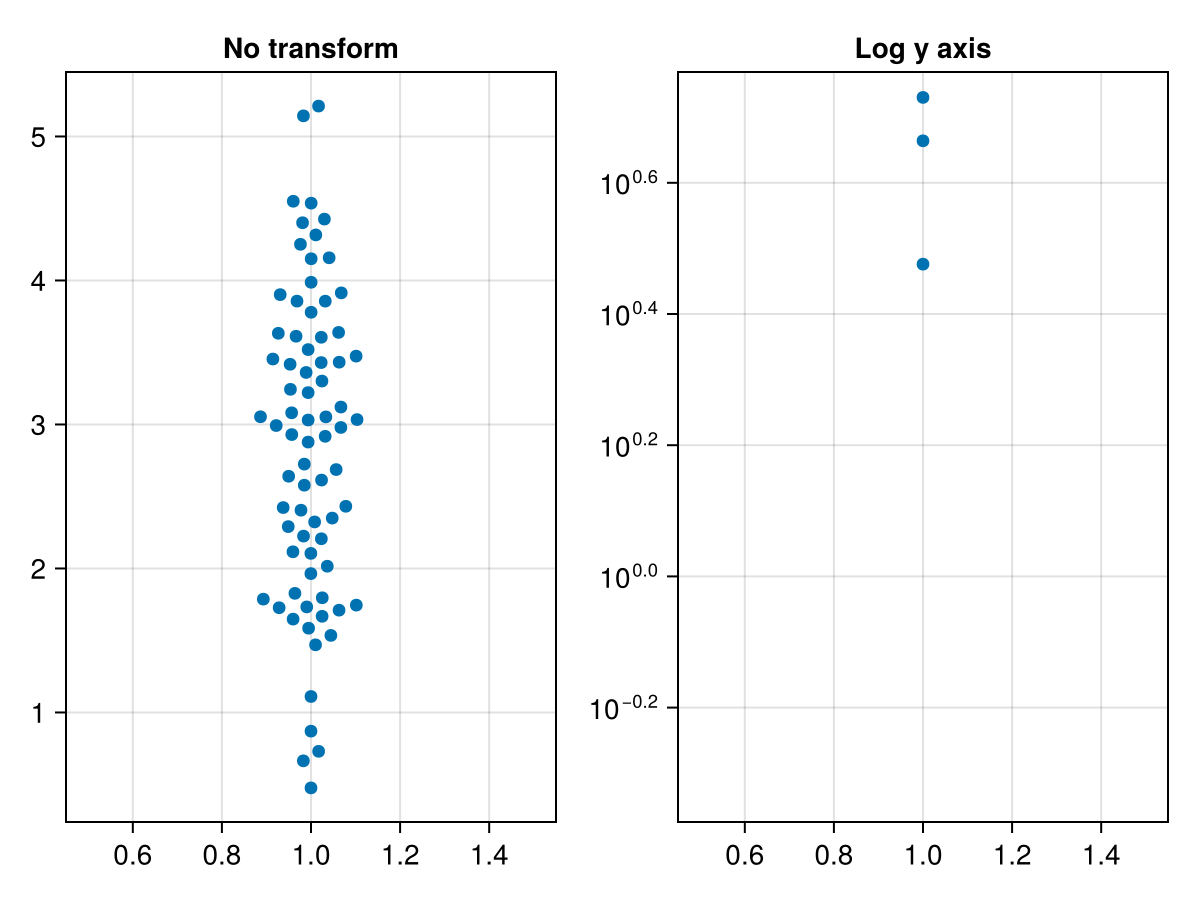
Note how the shape of the beeswarm is transformed in the left plot, because of the log scale.
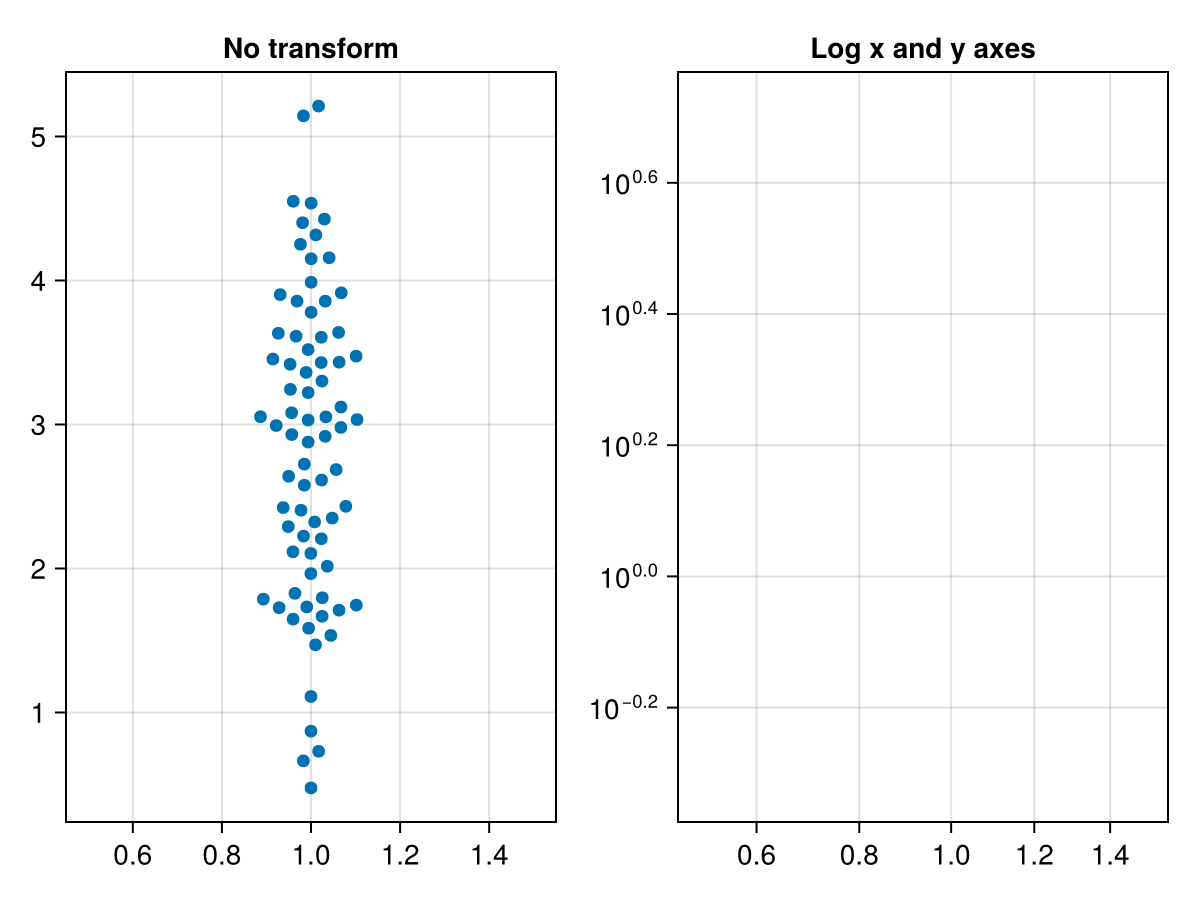
julia
ax2.xscale = Makie.pseudolog10
ax2.title = "Log x and y axes"
fig