Reference
sankey
Attributes
linkcolor
You can pass a scalar to color all links the same:
using SankeyMakie, CairoMakie

connections = [
	(1, 2, 100),
	(1, 3, 50),
	(1, 4, 70),
]

sankey(connections, linkcolor = :tomato, axis = hidden_axis())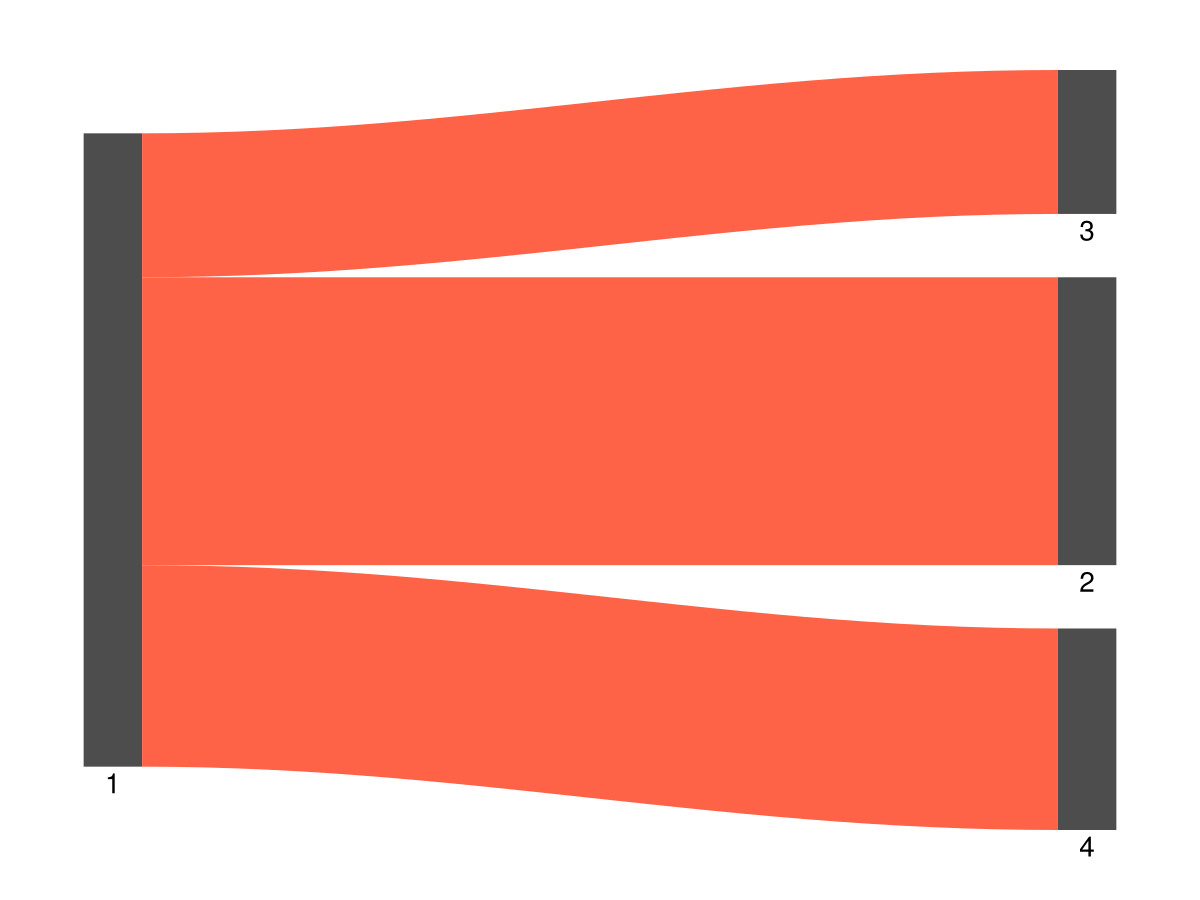
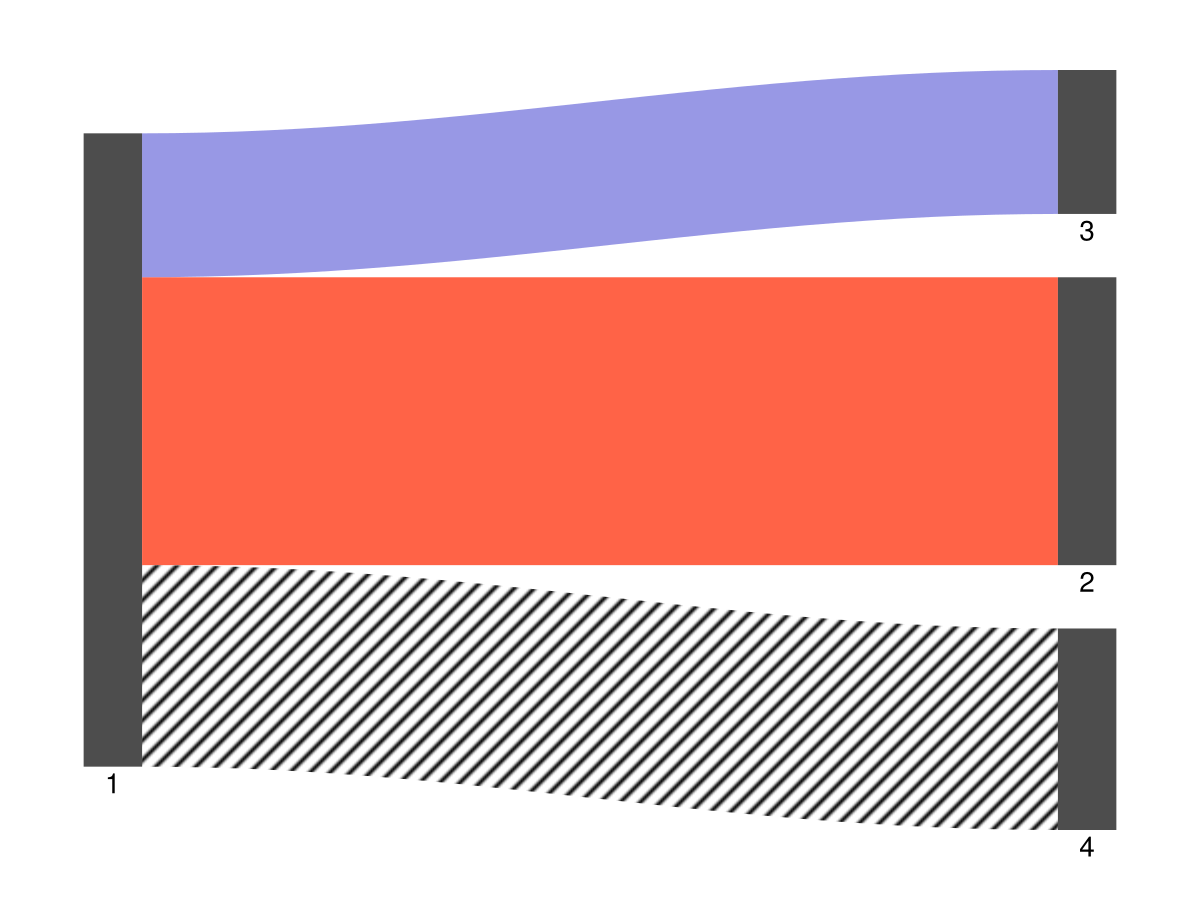
Or you pass an array of colors, in which case the order must match the connections array:
using SankeyMakie, CairoMakie

connections = [
	(1, 2, 100),
	(1, 3, 50),
	(1, 4, 70),
]

sankey(
	connections,
	linkcolor = [:tomato, RGBAf(0.2, 0.2, 0.8, 0.5), Pattern('/')],
	axis = hidden_axis()
)
You can also color the links with the color of their source or target nodes, with an alpha multiplier to visually separate nodes from links:
using SankeyMakie, CairoMakie

connections = [
	(1, 2, 100),
	(1, 3, 50),
	(1, 4, 70),
	(5, 4, 30),
]

f = Figure()

nodecolor = [:tomato, :bisque, :teal, :goldenrod, :violet]

sankey(
	f[1, 1],
	connections;
	axis = (; title = "SourceColor(0.2)", hidden_axis()...),
	nodecolor,
	linkcolor = SankeyMakie.SourceColor(0.2),
)

sankey(
	f[1, 2],
	connections;
	axis = (; title = "TargetColor(0.5)", hidden_axis()...),
	nodecolor,
	linkcolor = SankeyMakie.TargetColor(0.5),
)

f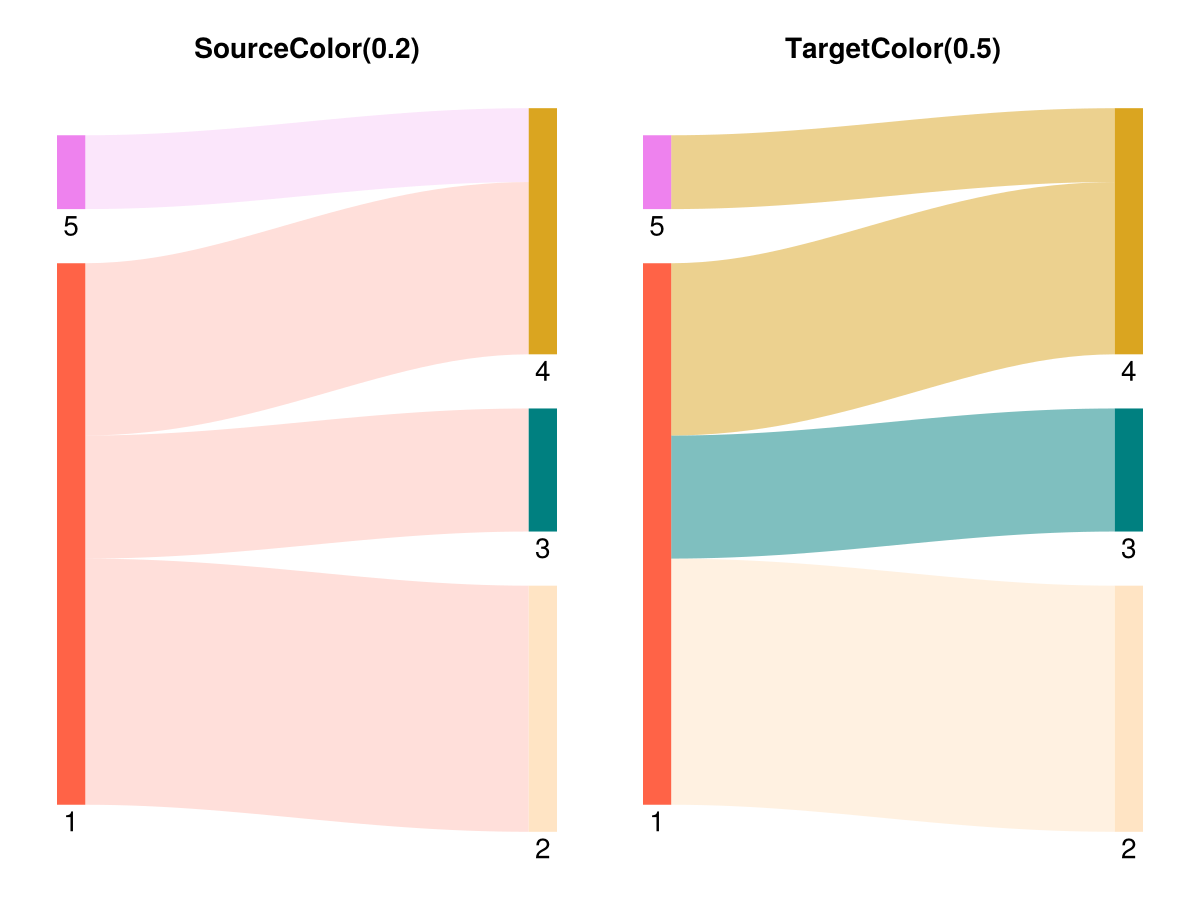
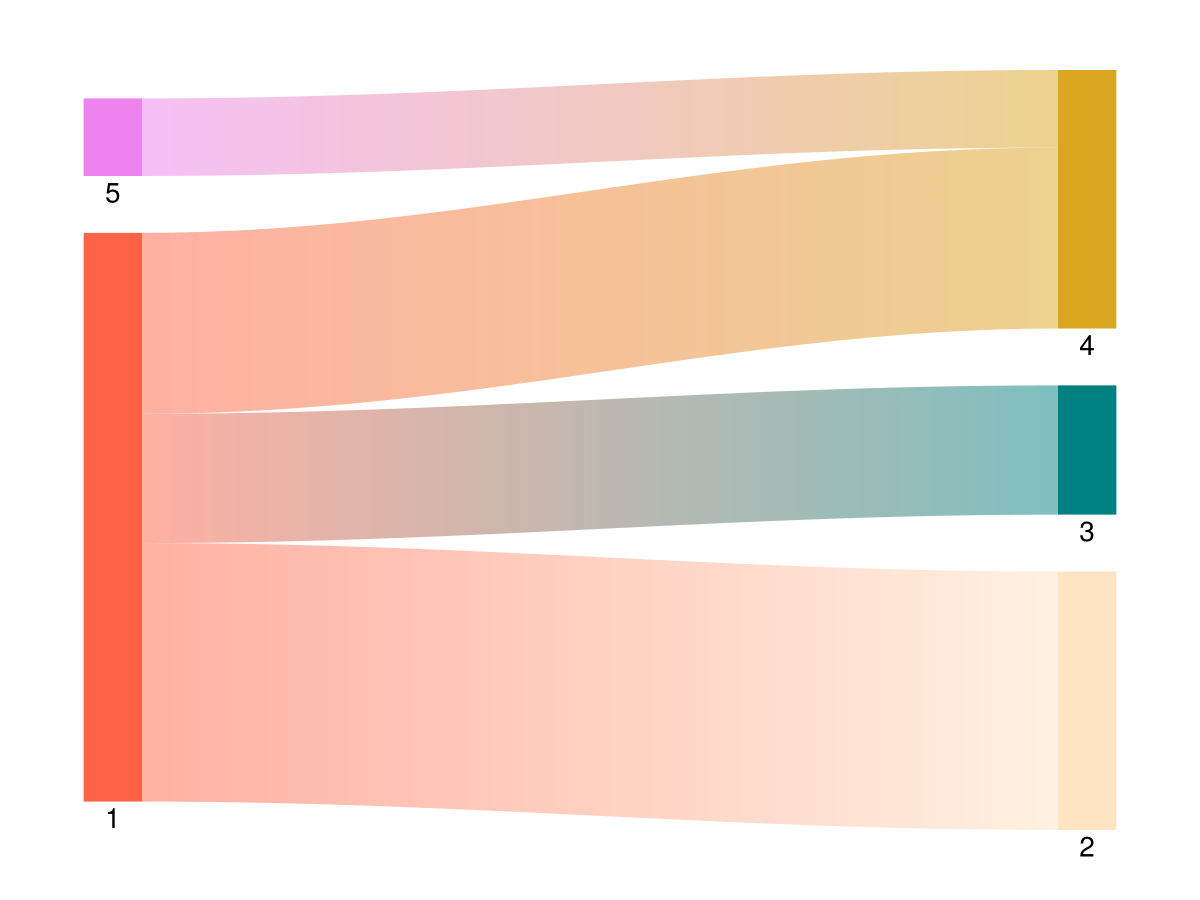
And finally, you can color them with a gradient from source to target color, using Gradient:
using SankeyMakie, CairoMakie

connections = [
	(1, 2, 100),
	(1, 3, 50),
	(1, 4, 70),
	(5, 4, 30),
]

nodecolor = [:tomato, :bisque, :teal, :goldenrod, :violet]

f, ax, san = sankey(
	connections;
	axis = hidden_axis(),
	nodecolor,
	linkcolor = SankeyMakie.Gradient(0.5),
)
nodecolor
This can be either a scalar color for all nodes at once:
using SankeyMakie, CairoMakie

connections = [
	(1, 2, 100),
	(1, 3, 50),
]

sankey(connections, nodecolor = :tomato, axis = hidden_axis())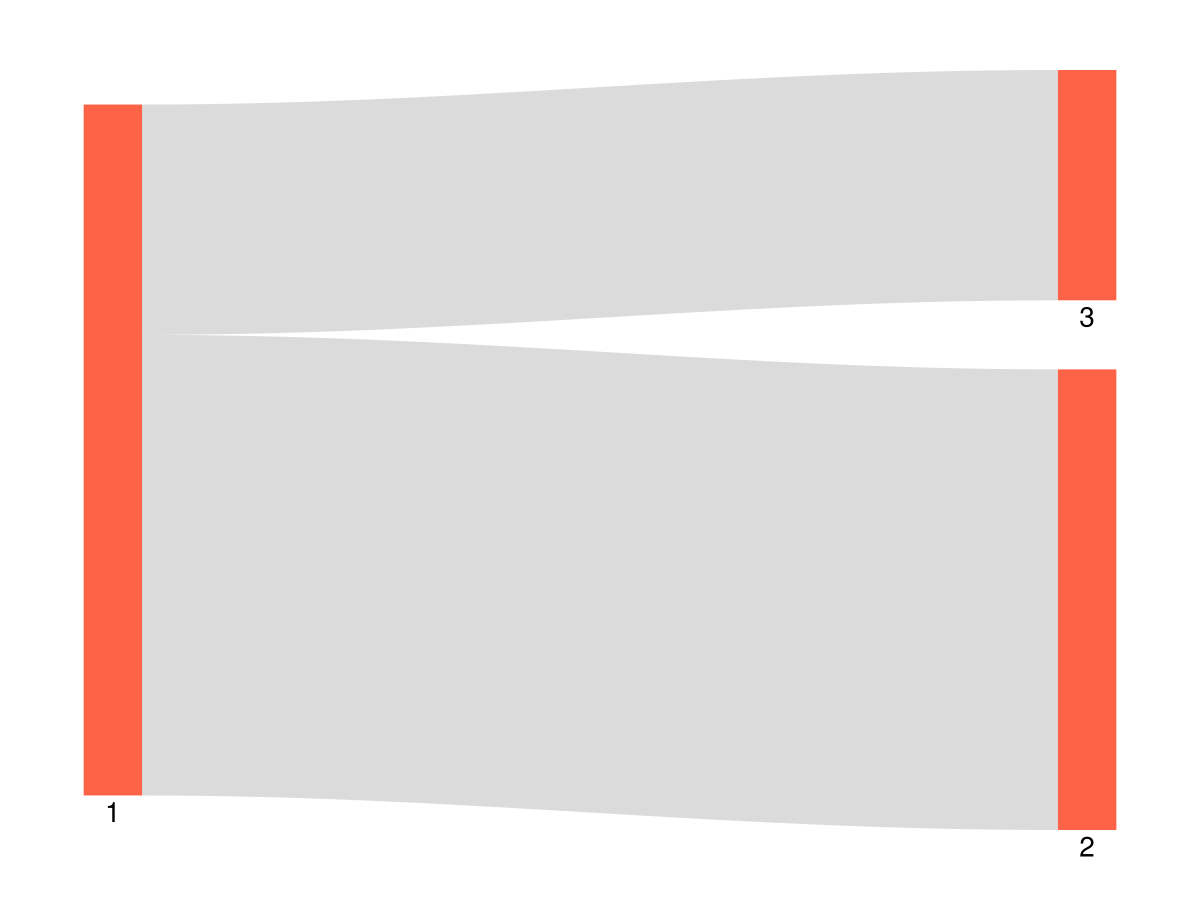
Or you can specify an array of colors:
sankey(connections, nodecolor = [:tomato, RGBf(0.4, 0.6, 0.9), Pattern('/')], axis = hidden_axis())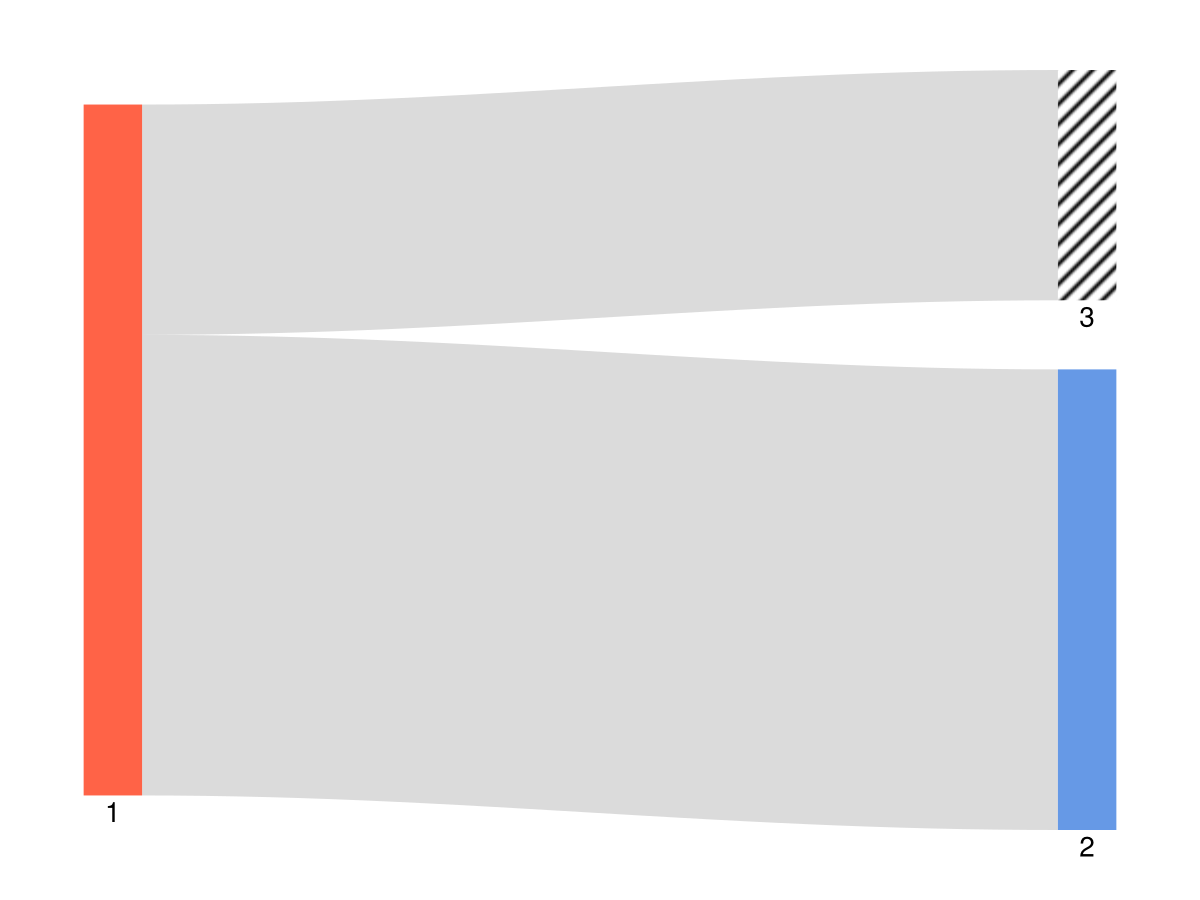
nodelabels
By default, nodes are simply labelled sequentially.
using SankeyMakie, CairoMakie

connections = [
	(1, 2, 100),
	(1, 3, 50),
]

sankey(connections, axis = hidden_axis())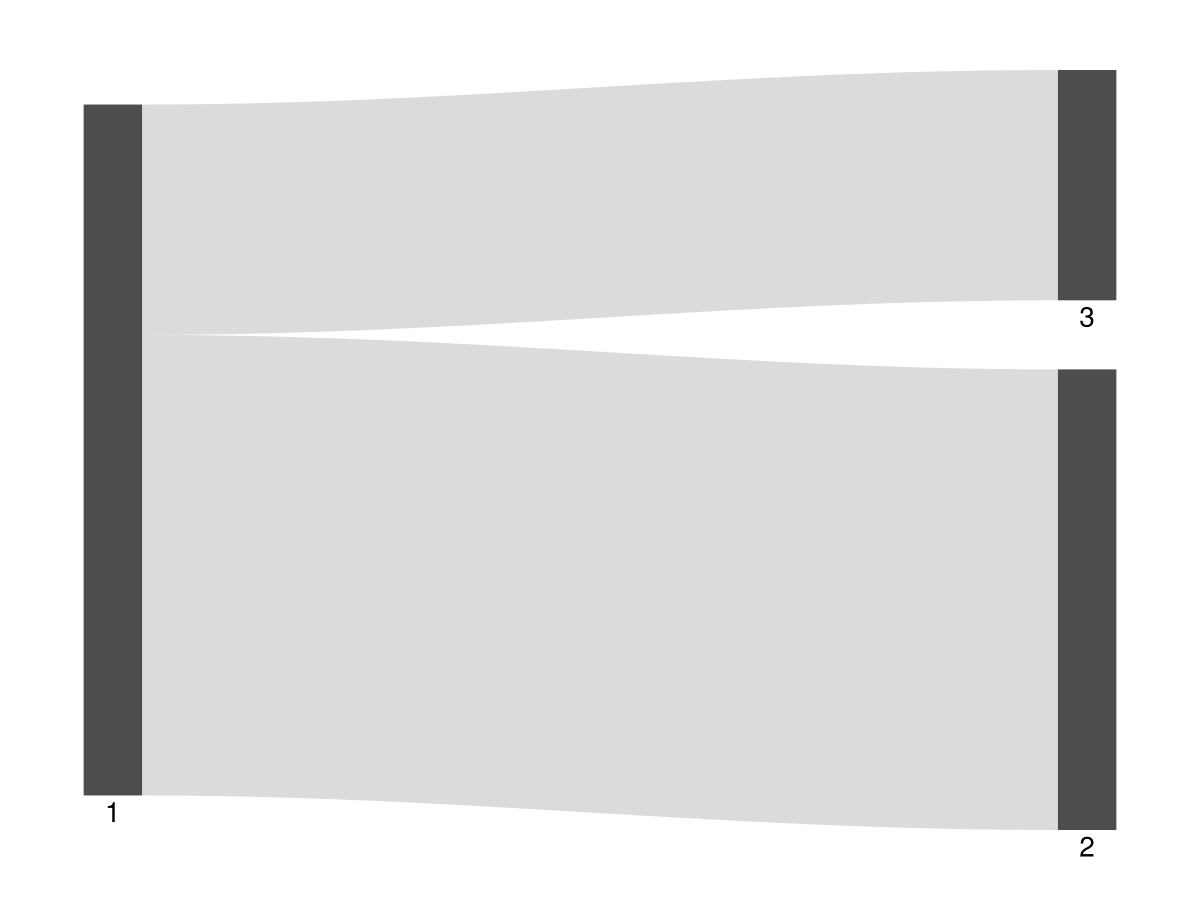
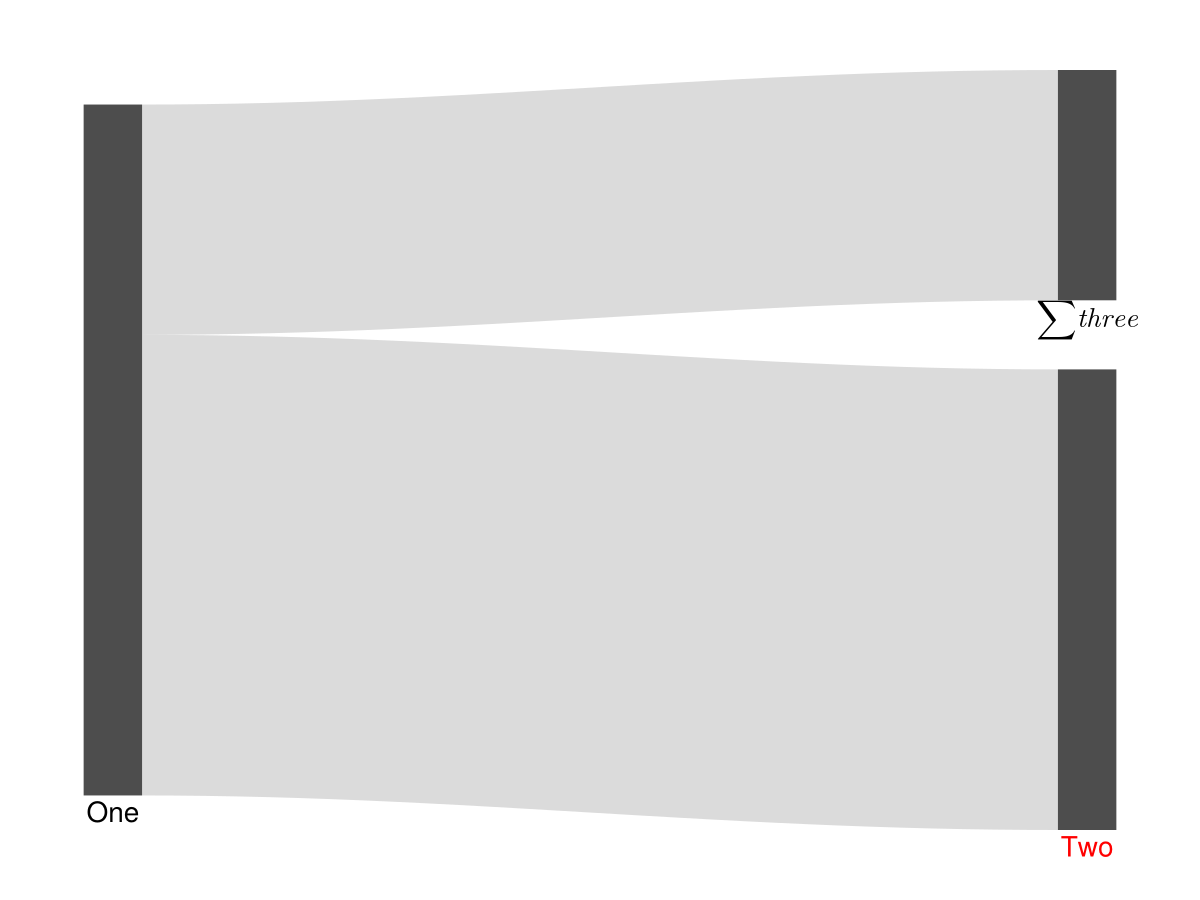
The nodelabels attribute takes a vector of labels, which can be anything that Makie's text function supports.
sankey(
	connections;
	nodelabels = [
		"One",
		rich("Two", color = :red),
		L"\sum{three}",
	],
	axis = hidden_axis()
)
forceorder
Sometimes we want the nodes in a sankey plot layer to be ordered in a specific way. To achieve this, we may have to override the default layout by specifying forceorder keyword.
In a panel with several sankey plots, the default layout sometimes picks different node orders between plots. Instead of manually specifying how to reorder each node, we can simply specify forceorder = :reverse to flip the order of the nodes of the plots we'd like to adjust.
The example below shows fictional data for an intervention on nature awareness. Before and after the intervention, the experimenters recorded the number of bird species and whether a bird feeder was present in participants' gardens.
using SankeyMakie, CairoMakie, Colors

connections1 = [
	(1, 5, 6),
	(1, 6, 4),
	(1, 7, 2),
	(2, 5, 26),
	(2, 6, 39),
	(2, 7, 22),
	(3, 5, 45),
	(3, 6, 166),
	(3, 7, 152),
	(4, 5, 3),
	(4, 6, 143),
	(4, 7, 432),
]

connections2 = [
	(1, 3, 24),
	(1, 4, 139),
	(2, 3, 8),
	(2, 4, 877),
]

colors = parse.(Colorant, ["#AE0404", "#D13D15", "#EAAF2E", "#74D8BD"])

f = Figure(size = (720, 400), backgroundcolor = RGBf(0.95, 0.95, 0.95))
gl = f[1, 1] = GridLayout()
ax1 = Axis(gl[1, 1]; hidden_axis()...)
ax2 = Axis(gl[1, 2]; hidden_axis()...)

labels1 = ["0", "1-3", "3-10", "10+", "1-3", "3-10", "10+"]

sankey!(
    ax1,
	connections1,
    nodelabels = labels1;
	nodecolor = [colors..., colors[2:4]...],
	linkcolor = SankeyMakie.TargetColor(0.2),
)

Label(
    gl[1, 1, Top()],
    "Number of bird species";
    valign = :bottom,
    font = :bold,
    padding = (0, 0, 5, 0),
    fontsize = 16
)

labels2 = repeat(["No", "Yes"], outer=2)

sankey!(
    ax2,
	connections2;
    nodelabels = labels2,
	nodecolor = repeat(colors[[1, 4]], 2),
	linkcolor = SankeyMakie.TargetColor(0.2),
	forceorder = :reverse,
)

Label(
    gl[1, 2, Top()],
    "Bird feeder present";
    valign = :bottom,
    font = :bold,
    padding = (0, 0, 5, 0),
    fontsize = 16
)

f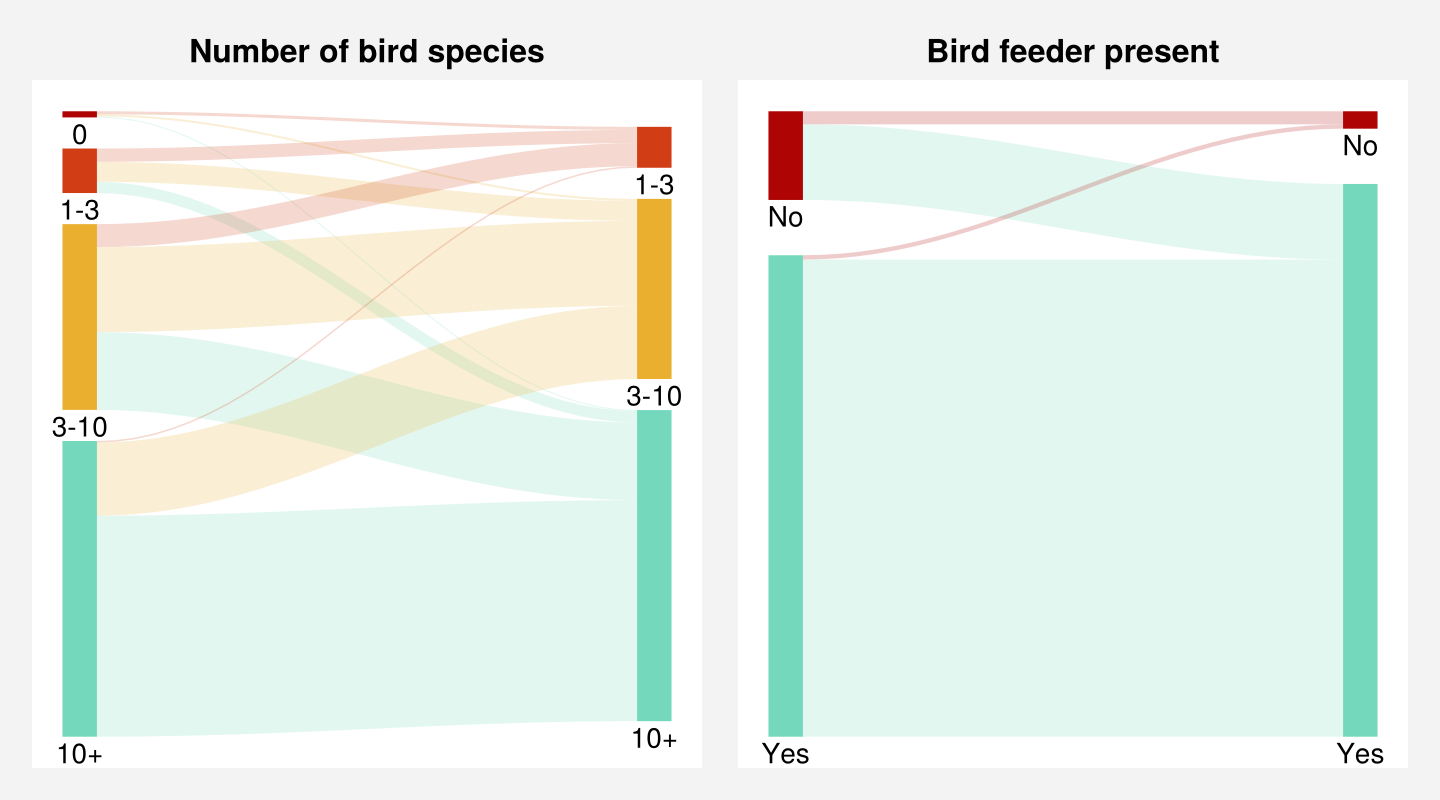
The right sankey plot would have had the 1+ category at the top if we had not specified forceorder = :reverse.
Manual reorder
We could have achieved the same result by manually specifying nodes that should be preceded by other nodes.
sankey!(
    ax2,
	connections2;
    nodelabels = labels2,
	nodecolor = repeat(colors[[1, 4]], 2),
	linkcolor = SankeyMakie.TargetColor(0.2),
	forceorder = [2 => 1, 4 => 3],
)
The vector of pairs [2 => 1, 4 => 3] specifies that node 2 should precede node 1, and that node 4 should precede node 3. Note that this approach will only work if the specified nodes are in the same layer.
While this is still feasible for a sankey plot like the one shown above it can turn into a complicated task as the number of nodes grows. That being said, it offers fine-grained control in situations where the :reverse approach does not produce the intended result.