SankeyMakie.jl
Sankey plots for Makie.jl
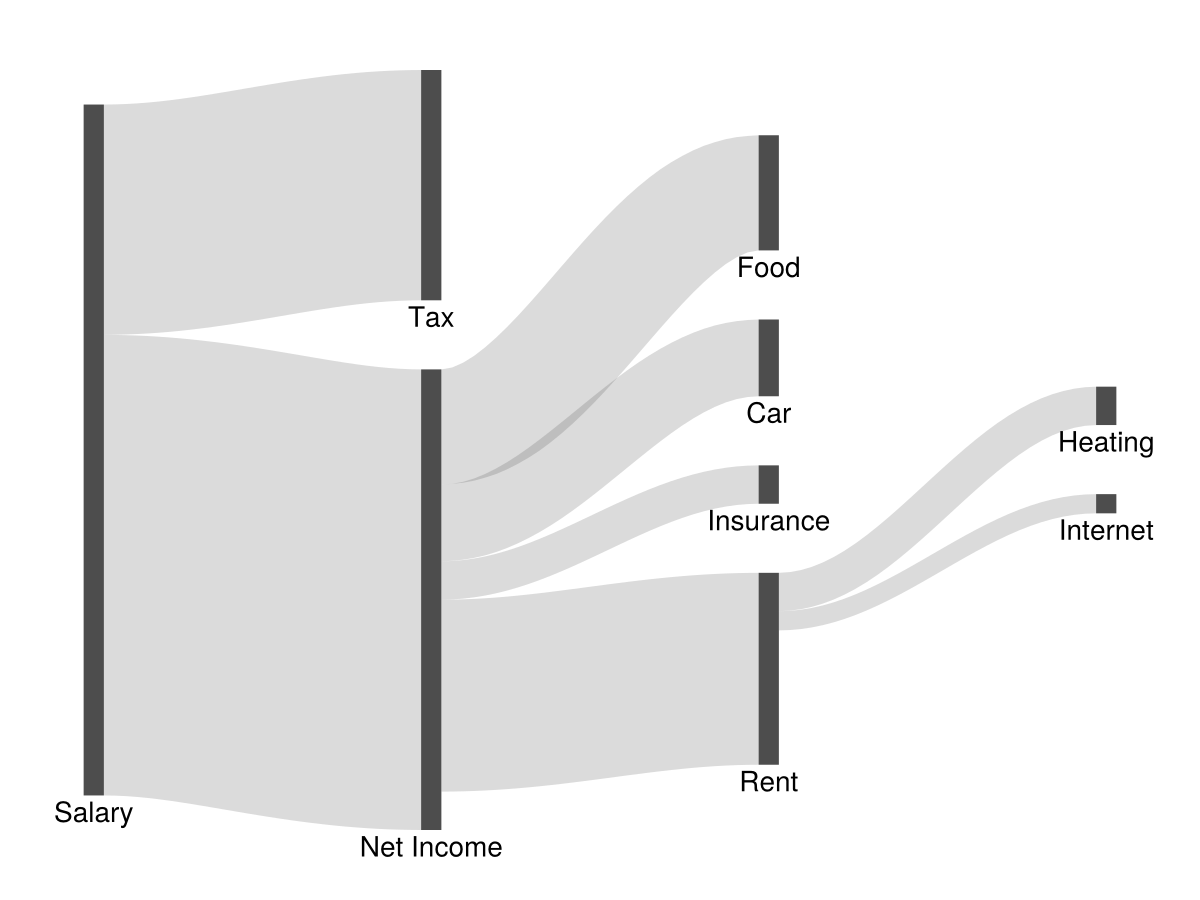
Sankey plots are used to visualize inflows and outflows between connected nodes. You specify the connections and their numerical weights and SankeyMakie computes an appropriate layout for you.
using SankeyMakie, CairoMakie

connections = [
    (1, 2, 1200), (1, 3, 600), (2, 5, 100), (2, 4, 500),
    (2, 9,  300), (2, 6, 200), (4, 7, 50), (4, 8, 100),
]

labels = [
    "Salary", "Net Income", "Tax", "Rent", "Insurance",
    "Car", "Internet", "Heating", "Food",
]

sankey(connections; nodelabels = labels, axis = hidden_axis())